Standard Deviation (SD) measures the statistical dispersion of IQ scores across population samples. Because modern tests map raw results to a relative bell curve (Mean = 100), the choice of Standard Deviation (either SD15 or SD24) dramatically changes the numerical output value for the exact same level of intelligence.
1. The Normal Distribution Bell Curve
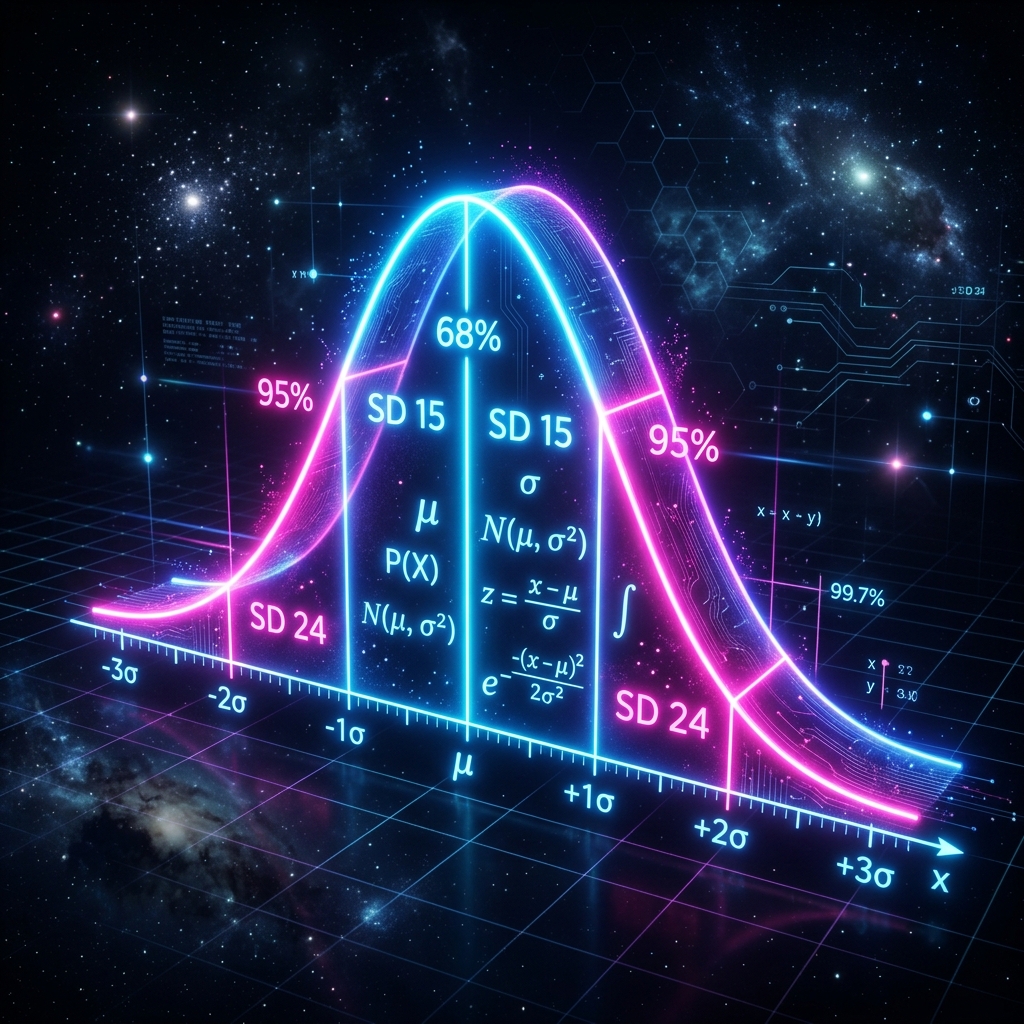
Plotted globally, human intelligence follows a symmetrical standard bell curve. Under the standard SD15 metric:
- ±1 SD (IQ 85 to 115) houses 68.27% of the population.
- ±2 SD (IQ 70 to 130) houses 95.45% of the population.
- Above +2 SD (IQ 130+) represents the top 2.28% of humanity (the gifted threshold).
2. Scale Comparison: SD15 (WAIS) vs. SD24 (Cattell/Mensa)
Standard clinical tests use SD15. Historical scales and some MENSA branches used SD24. They represent the exact same level of intelligence (percentile), but use different size markings:
| Percentile Rank | Rarity Index | IQ Score [SD 15] | IQ Score [SD 24] |
|---|---|---|---|
| 50.0% (Average) | 1 in 2 people | IQ 100 | IQ 100 |
| 15.8% (+1 SD) | 1 in 6 people | IQ 115 | IQ 124 |
| 2.28% (Gifted Limit) | 1 in 44 people | IQ 130 | IQ 148 |
| 2.0% (MENSA Limit) | 1 in 50 people | IQ 131 | IQ 150 |